Edit chart
Loading graph
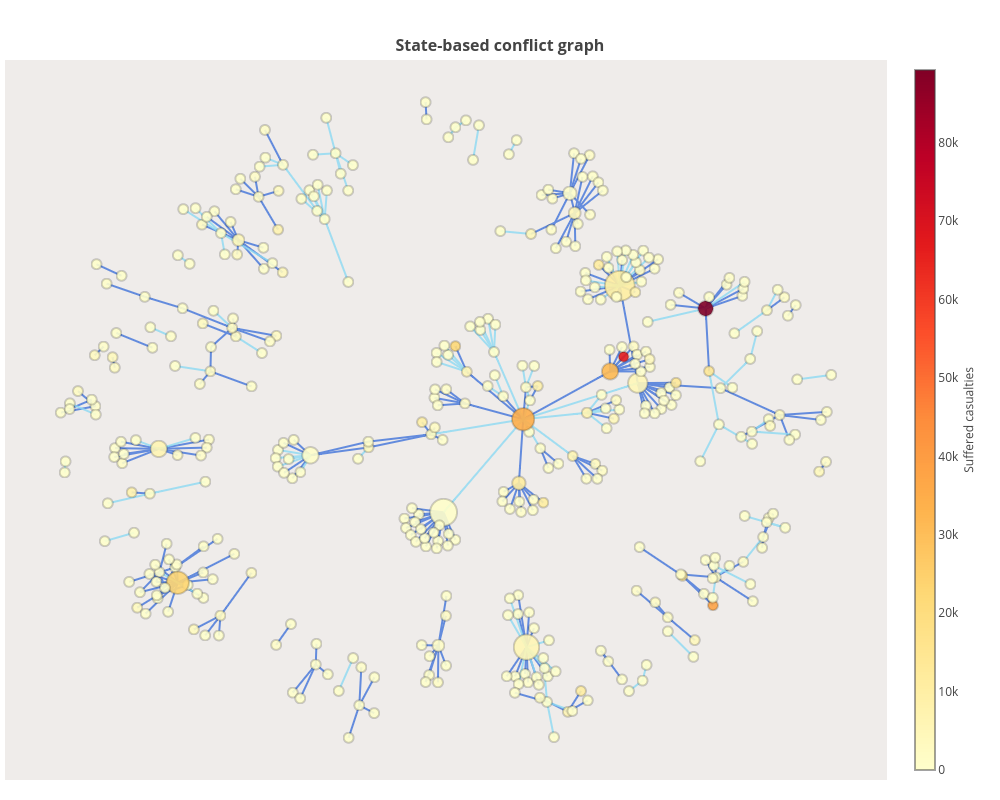
Vikjan94's interactive graph and data of "State-based conflict graph" is a line chart. The x-axis shows values from -1.14178743173396 to 1.1039220251465185. The y-axis shows values from -1.0912765330711196 to 1.1221627573098156.